
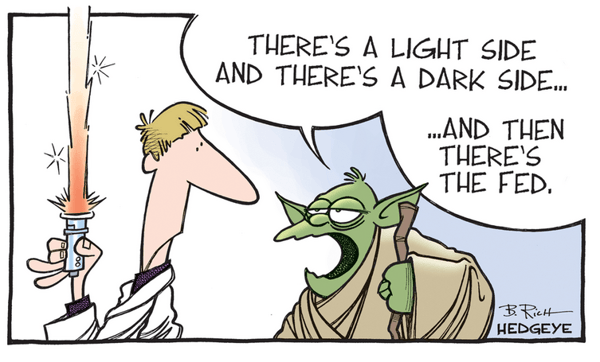
May the Force be with you
The Verger investment team hosted our Q1 2021 investment update webinar earlier this month on May 4th. For those of you who may have missed it, May the 4th is recognized as Star Wars Day in popular culture thanks to a play on the iconic phrase “May the force (sub: fourth) be with you”. We took the opportunity provided by the timing of our discussion to highlight the interesting parallels between the themes and lessons of George Lucas’ Star Wars saga and the investment landscape today. The good, the bad. The light side, the dark side. We explore these and everything in between as we dive into the forces driving the market today.
Verger’s quarterly investment webinar is open to qualified investors only. To request an invitation to next quarter’s call, please contact us using the form found here.
A long time ago in a galaxy far, far away
The coronavirus fueled market crash in the first quarter of last year certainly feels like a long time ago in a galaxy far, far away. The first quarter of 2021 can be characterized by a renewed sense of optimism as both economic and public outlook have been heavily influenced by the expanded availability of COVID-19 vaccines. The resulting reopening of the economy – easing restrictions on schools, the workplace, social venues, etc. – coupled with additional government stimulus were two major forces priming the U.S market for an uplift. And that is exactly what we saw in the first quarter.
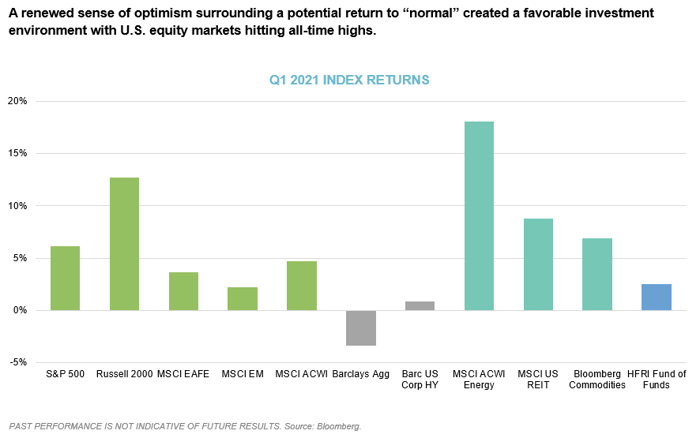
Over the three months of Q1, there was strong performance across most risk assets, with U.S. equities hitting all-time highs. Equity markets have rallied effectively in a straight line since March 23, 2020, driven almost exclusively by multiple expansion. Accordingly, equities appear expensive relative to historical valuations, but their dividend yields look attractive compared to those currently offered by bonds. Looking ahead, the combination of continuing fiscal and monetary policy, low bond yields (at least for now), moderate inflation, and a consensus expectation of strong earnings per share (EPS) growth should provide a supportive backdrop for equity markets. However, we balance this view by acknowledging that current results are coming off a very low bar due to the COVID-19 pandemic. Much of the positive expectations may already be priced and while the stock market boom has been impressive, it has not prompted underperforming companies, their supply chains, and their management to improve – in many cases it has just made it easier for them to finance and survive.
The primary laggard for the quarter was fixed income with key indices suffering their largest quarterly decline in decades due to rising rates and increased inflation expectations. Over the first quarter, U.S. 10-Year Treasury yields rose 75 basis points to over 1.7%. Although Fed Chairman Jerome Powell and the Federal Open Market Committee (FOMC) acknowledge improvements within the economy, they attributed any inflation to “transitory factors” that are unlikely to be sustained and, therefore, announced no expected changes to policy, capping Treasury yields from rising further.
Not to be ignored was the standout performance in the energy sector which continued the run it began in the fourth quarter and outpaced all market segments. With the pandemic moving further into the rearview mirror, rising oil prices and increased expectations for travel drove demand for and encouraged investment in energy.
Your eyes can deceive you. Don’t trust them. – Obi-Wan Kenobi
Taking a deeper look at equity returns, we largely see a continuation of the themes that took hold in the fourth quarter. Smaller names outperformed larger ones. Value companies outperformed growth companies. The one trend that reversed was that U.S. equities outperformed their international counterparts, which had outperformed in the fourth quarter.
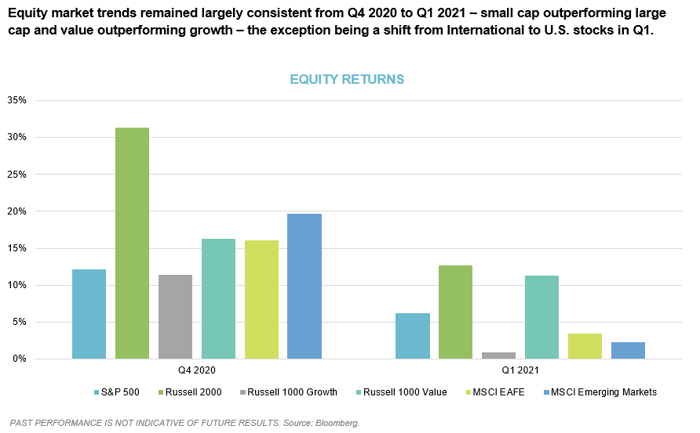
But do not let what you see on the surface deceive you. Positive numbers for the quarter and overall trends in volatility since March 2020 do well to mask the considerable turbulence hiding below.
In January, short squeezes on high short interest stocks such as GameStop and AMC put pressure on hedge funds and fueled countless headlines about the power of the retail investor. In February, managers had to navigate the sharp correction in low short interest, large capitalization stocks while watching celebrity-backed, blank-check SPACs explode in number. In March, both Russell small cap positions and NASDAQ tech exposures corrected by 10%, and the market experienced a fire sale of stocks owned by Bill Hwang’s highly levered Archegos family office to meet margin calls. This increased volatility of individual positions in the first quarter highlights a salient feature of the market over the past year…it embodied elevated levels of risk and opportunity just under the surface.
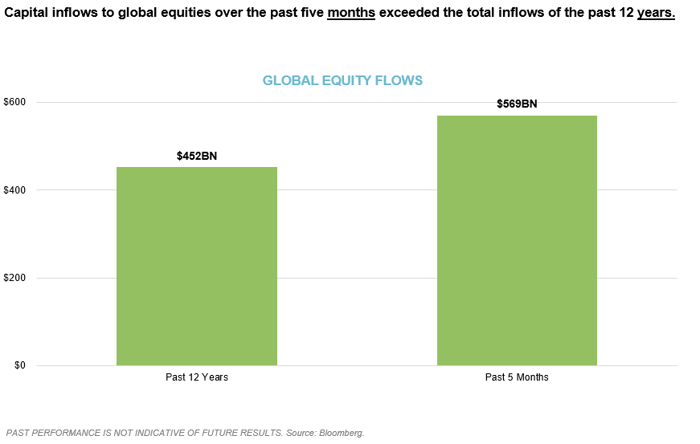
Further illustrating the fragility of the current market was the striking increase in global equity inflows. As shown below, capital inflows to global equities over the past five months exceeded the total inflows of the past 12 years. Let that sink in. This represents a tremendous amount of fuel poured onto a market that was already on fire – printing money, handing it out, record margin debt, record volatility, spectacular over-valuations, retail speculation, and financial leverage piled on top of operating leverage provided by low rates and fed purchases. And there is more stimulus on tap.
So, while performance was positive, we still see a market characterized by risk and fragility. But with risk and fragility comes plenty of opportunity, as well.
The force is strong with this one. – Darth Vader
Market Opportunities: Inflation
History tends to repeat itself, and while it may not be wise to live in the past, it is important to take those lessons with us in preparation for the future.
The chart below illustrates the historical fluctuations between the relative performance of global value companies and global growth companies. The periods in green represent growth outperforming value, and to the far right, you will see a 14-year trend of growth outperformance. However, as noted earlier, the spread has diminished, and we have started to see a reversal with value returning to favor. Using past trends as an indicator, we can see that these shifts, when they occur, often endure for several years, and make a lasting impact. And in today’s market there is more to this opportunity than meets the eye thanks to the fiscal and monetary policy forces at play.
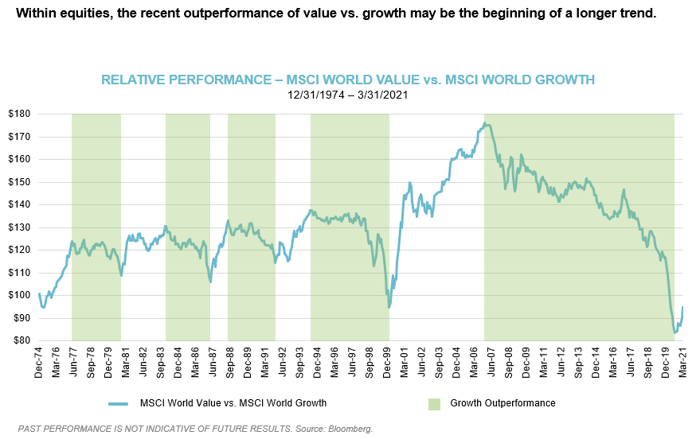
A bullish position on value is more than just a value vs. growth play. It ties back to what we believe to be the biggest investment theme of the quarter and periods ahead – the return of inflation (or, as some call it, reflation).
Think about growth stocks as if they were bonds. Inflation is such a significant risk for bondholders because it erodes the purchasing power of their fixed rate income payments over time. The same is true of the promised future growth in revenue or profits for growth stocks. The future value of these revenues or profits will not be the same in an inflationary environment. Value stocks, however, already have cash flows that are likely to decrease into the future. Thus, higher interest rates should hurt value stocks less than growth stocks since the higher hurdle rate weakens the value of future growth.
The current environment is reminiscent of several other periods over the past eighty years after which value, especially small and mid-cap value, snapped back in a material way, which presents several opportunities for investors to take advantage of this trend, should it continue.
Similarly, foreign developed stocks have tended to outperform U.S. stocks when inflation is higher and underperformed when it is lower, which also opens opportunities for long strategies in emerging markets and other non-U.S. assets.
While there is still debate as to whether commodities can truly serve as an inflation hedge, it is important to note that we have seen dramatic increases in commodity prices over the past year. Lumber is up 265% (!!!) but we have also seen a huge increase in WTI crude oil (210%), gasoline (182%), corn (84%), and copper (83%), just to name a few. It is likely that these increases are more of a result of demand and logistical issues, but it does not diminish the fact that we remain optimistic on a commodities allocation should we see growing inflationary fears.
Market Opportunities: Japan
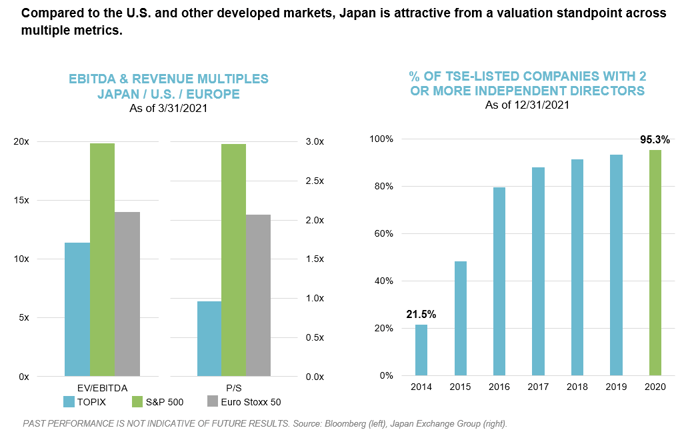
Often the best opportunities are those that are underappreciated or a little off the radar. Japanese small cap equity may just be such an opportunity.
First, valuations for Japanese stocks (TOPIX) are more attractive than their U.S. and European counterparts, both on an enterprise value to EBITDA (EV/EBITDA) and Price/Sales (P/S) basis. Second, while Japanese companies were historically managed more for their employees than for their shareholders, this has started to change with a shift towards improved stewardship and corporate governance. As shown below, the number of independent directors for Japanese companies has increased dramatically over the last six years. And, finally, the Japanese equity market has a disproportionately large number of small cap companies which creates an opportunity for active managers to add alpha.
Market Opportunities: Credit Hedges
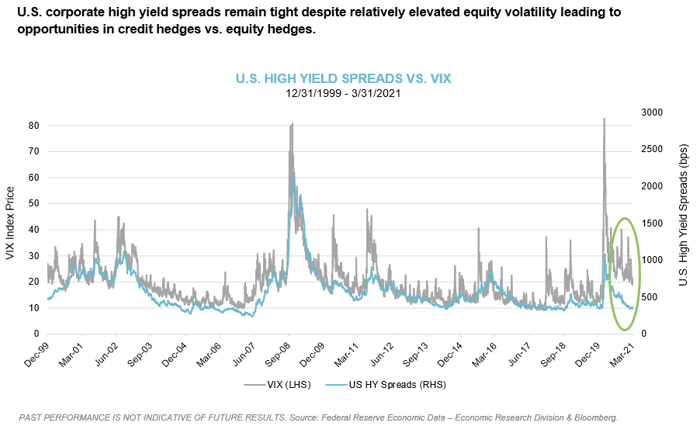
Over time, we think the best way to grow and compound capital is to participate in up markets while also protecting capital during market drawdowns. Historically, equity hedges have been a successful diversifying strategy utilized to help provide both protection and liquidity during market selloffs, last February/March serving as a good example.
According to the chart below, while equity volatility (gray line) has declined dramatically from its highs approximately one year ago, it is still quite elevated compared to its history. However, because credit spreads (blue line) are back near all-time lows, credit hedges may be more attractive as a portfolio diversifier than equity hedges and more cost effective should markets remain strong.
Market Opportunities: Real Estate
Over the past several years, real estate investments have generated steady cash flow and returns significantly above traditional sources of yield – such as corporate debt – with only slightly more risk, which is important in a zero-rate environment.
Since the virus outbreak, however, this reality has changed, and real estate players have been hit hard across the value chain. Service providers are struggling to mitigate health risks for their employees and customers. Many developers cannot obtain permits and they face construction delays, stoppages, and potentially shrinking rates of return (remember, lumber is up 265%!). Meanwhile, many asset owners and operators face drastically reduced operating income, and almost all are nervous about how many tenants will struggle to make their lease payments. “Concession” and “abatement” are the words of the day, and players are working rapidly to figure out for whom they apply and how much.
Not all real estate assets are performing the same way during the crisis. The market seems to have pivoted mostly on the inherent degree of physical proximity among an asset class’s users – even more so than on its lease length. Assets that have greater human density seem to have been the hardest hit: healthcare facilities, regional malls, lodging, and student housing have sold off considerably. By contrast, self-storage facilities, industrial facilities, and data centers have faced less-significant declines.
There is still opportunity in real estate, but perhaps even more in the ability to be active, liquid, and nimble. Liquid strategies within real estate allow managers to more easily diversify across property type and geography, while also being able to be more tactical.
Don’t underestimate the Force. - Darth Vader
There is a memorable line from the first Star Wars movie, A New Hope, which was released in 1977. Obi Wan Kenobi describes the Force to a young Luke Skywalker saying, “The Force is what gives a Jedi his power…it surrounds us and penetrates us; it binds the galaxy together.” As we reflect on similarities from the Star Wars saga with the world today, we think he may have meant the Fed, not the Force.
The most important narratives of the Star Wars franchise revolve around overconfidence, unrealistic optimism, self-serving judgments, and inertia – all of which are applicable to the environment we face as investors in 2021. The messages of good versus evil, politics, and the ability of individuals to alter what seems like destiny may be apparent in the movie, but reality today seems to be more a narrative of magic than of realistic fundamentals. That the Fed will do whatever it takes to levitate the market, prompting stocks to continually rise as we print our way to global prosperity. That force is strong, but, as in the movie, there is a dark side to momentum, arrogance, and unhinged spending, power, and optimism.
We continue to believe that the true power of the market is harnessing the force of compounding returns. Not forgetting the power of diversification, market discipline, and dedicated focus. We continue to advocate for multi-market, antifragile portfolios designed to continually support investor requirements and withstand volatile markets. Preparing for unexpected headwinds, avoiding the drawdowns, bracing for market volatility…as the Mandalorian mantra goes, “This is the way.”
All investments involve risk, including possible loss of principal.
Not all strategies are appropriate for all investors. There is no guarantee that any particular asset allocation or mix of strategies will meet your investment objectives. Diversification does not ensure a profit or protect against a loss.
One cannot invest directly in an index, and unmanaged indices do not incur fees and expenses.
This article is being provided for informational purposes only and constitutes neither an offer to sell nor a solicitation of an offer to buy securities. Offerings of securities are only made by delivery of the prospectus or confidential offering materials of the relevant fund or pool, which describe certain risks related to an investment in the securities and which qualify in their entirety the information set forth herein. Statements made herein may be materially different from those in the prospectus or confidential offering materials of a fund or pool.
This article is not investment or tax advice and should not be relied on as such. Verger Capital Management (“Verger”) specifically disclaims any duty to update this article. Opinions expressed herein are those of Verger and are not a recommendation to buy or sell any securities.
This article may contain forward-looking statements relating to future events. In some cases, you can identify forward-looking statements by terminology such as “may,” “will,” “should,” “expect,” “anticipate,” “believe,” “potential,” or “continue,” the negative of such terms or other comparable terminology. Although Verger believes the expectations reflected in the forward-looking statements are reasonable, future results cannot be guaranteed. Except where otherwise indicated, all of the information provided herein is based on matters as they exist as of the date of preparation and not as of any future date and will not be updated or otherwise revised to reflect information that subsequently becomes available, or circumstances existing or changes occurring after the date hereof.
References to indexes and benchmarks are hypothetical illustrations of aggregate returns and do not reflect the performance of any actual investment. Investors cannot invest in an index and do not reflect the deduction of the advisor's fees or other trading expenses.