
Groundhog Day
Not even the famed prognosticating groundhog, Punxsutawney Phil, could have foretold what 2020 had in store for us. And despite Phil’s sunny outlook on 2021, we can relate to Bill Murray when he said, “It feels like Groundhog Day…again.” The fourth quarter of 2020 felt like the third, and now 2021 feels eerily similar to its predecessor as well.
Looking at 2020’s Shadow
Many may prefer to forget 2020, but it was a historic year on many levels.
The year began with a strong start followed by a fast fall off, with the VIX (CBOE Volatility Index) going from 14 at the start of January to over 80 in mid-March. And while March holds the record for how quickly stocks dropped into bear market territory (only 16 days for the S&P 500!), it followed that up with the quickest recovery from bear market territory in history. When paired with a dramatic drop in commodities prices, including oil futures trading at negative prices, the first half of the year was not for the faint of heart.
Meanwhile, the largest fiscal stimulus package in history of over $3 trillion (representing 14.5% of the prior year’s GDP) was rolled out to help offset the highest unemployment rate since the Great Depression and the sharpest GDP contraction in U.S. history. When paired with significant monetary stimulus from the Fed including rate cuts, asset purchases, and expanded repo operations, the effort to stabilize the economy was a massive undertaking.
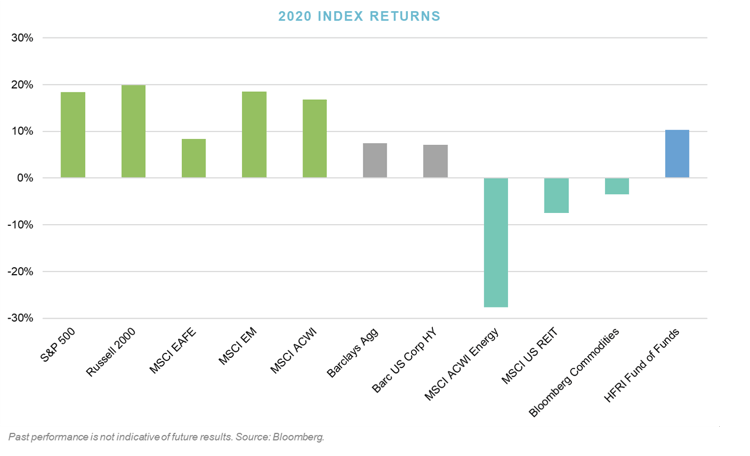
While the impact of these efforts on the economy will likely take time to materialize and may be further hampered by COVID-19 concerns, the effect on the markets was significant as they quickly returned to posting all-time highs. If you were Punxsutawney Phil or Rip Van Winkle and went into hibernation in January, you would have awakened in December thinking it was a pretty good year, with the few exceptions being energy, real estate, and commodities. Even energy, which was severely impacted by COVID-19, saw a record month in November as optimism around reopening and virus vaccinations grew. All this despite continued GDP contraction and elevated unemployment, which illustrates the obvious disconnect between the markets and our current economy.
The Fourth Quarter
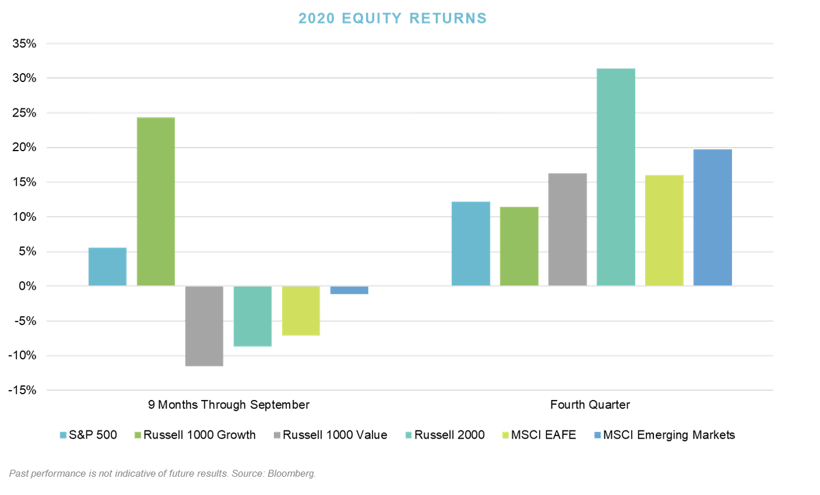
For the equity markets, the first nine months of 2020 were similar to what we’ve seen for the past several years – large cap outperformed small cap, growth outperformed value, and U.S. equities outperformed international. In the fourth quarter, these trends reversed, and we were rewarded for diversification in that part of the portfolio.
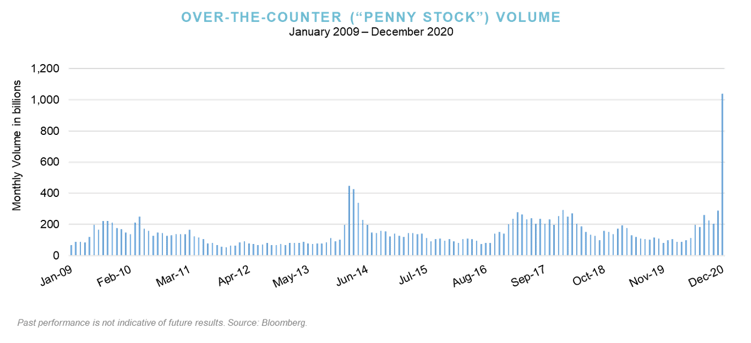
Yet, we continue to see potential signs of late stage behavior in much of the equity markets. This is often characterized by irrational investor behavior, especially on the part of individuals. Recent examples include dramatic increases in trading volumes, especially in lower priced penny stocks. As illustrated below, December trading volumes for these stocks peaked at over 1 trillion shares, which is significantly higher than any month over the prior twelve years.
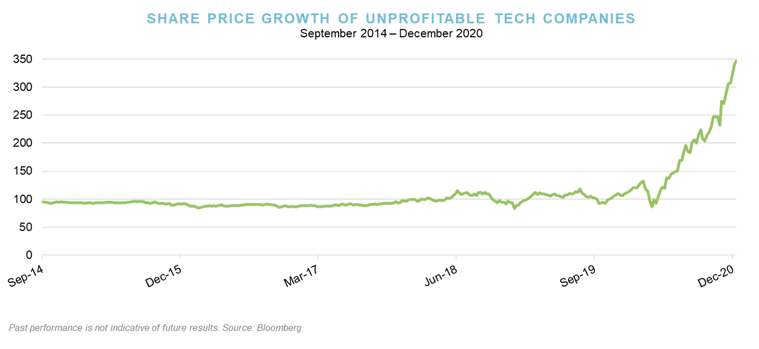
A second example is the rise of share prices for technology companies that are losing money. From the market bottom in late March 2020 to the end of the year, these unprofitable tech firms have returned more than 300%. As a reminder, these are companies that are losing money!
Much of this speculative behavior is being fueled by retail investors as ample liquidity and low debt costs are paired with more than 10 million new brokerage accounts that were opened over the past 12 months. The gamification of investing through free trading apps and a populist movement against the “Wall Street elite” exposed the fragility of the markets late in the year and into early 2021.
While our clients benefited from strong performance and the continued appreciation of risk assets in the fourth quarter, we remain concerned about the potential risks going forward.
The Weather Ahead
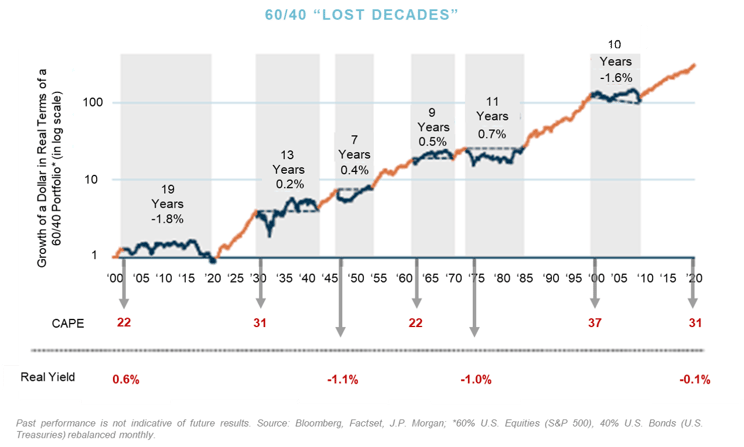
You have probably heard us say more than once that we do not see the next ten years behaving like the last ten. A 60/40 portfolio has done well over the past decade but significant uncertainties surrounding the global economy remain which might lead to more modest returns for both equities (high valuations, lower growth) and fixed income (low rates). There have been several lost decades for 60/40 portfolios when returns have been either flat or negative. These lost decades can be particularly trying for endowments and foundations as the opportunity to grow their assets may be limited. The combined impact of lower returns and the need to take distributions to fund operations can limit portfolio growth and may even cause portfolio contraction – add inflation and it can be devastating.
When has a 60/40 historically struggled? When equity valuations are high or fixed income yields are low. The graph below illustrates a 60/40 portfolio going back over 120 years. The beginning of each of the six lost decades is preceded by high equity valuations as measured by the Shiller cyclically adjusted price to earnings ratio (CAPE), low real yields as measured by the 10-year U.S. Treasury market, or both. Unfortunately, both conditions exist today, with CAPE at 31 times earnings and real yields basically at zero.
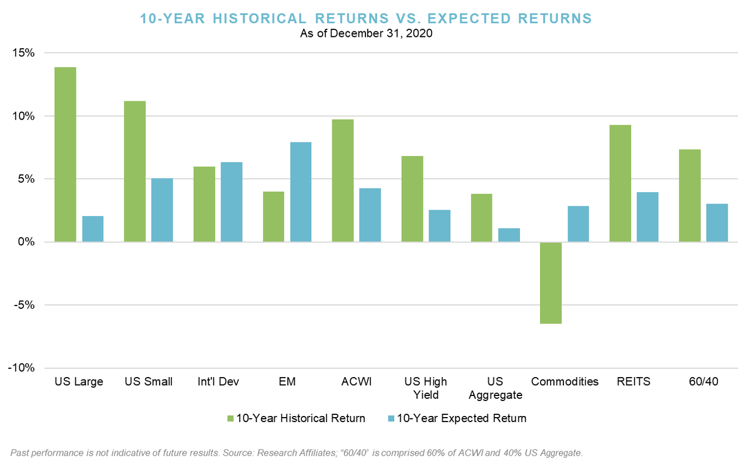
Taking a closer look back at historical returns for the last ten years, large cap U.S. equities have been the top performing asset class over the last decade, returning almost 14% annualized. Looking forward, due in large part to high U.S. large cap equity valuations, we expect other asset classes to generate higher returns. Within equities, both U.S. small cap and international equities (developed and emerging) appear more attractive. Additionally, a diversifying strategy such as commodities can be additive to a portfolio, especially in a period of higher inflation.
2021 Portfolio Opportunities
While our outlook for a traditional 60/40 portfolio is somewhat muted, we still see a multitude of opportunities looking ahead for those investors with the ability to further diversify and capture a variety of return streams. While we will maintain a diversified portfolio on behalf of our clients as we weigh our long-term responsibility to provide both growth and protection, there are a few specific areas where we believe there is immediate opportunity: venture capital, bank stocks, and commodities.
Venture Capital
Venture capital had a blockbuster year in 2020, with returns reaching an all-time high, despite the negative consequences of the coronavirus pandemic on global economies. The short-term disruption of the public markets did little to impact the performance of active venture funds both generally and within our client portfolios. Not only was venture capital performance impressive and additive to client performance, but U.S. venture capital funds set new records with regard to deal-making, exits, and fundraising, as illustrated below.
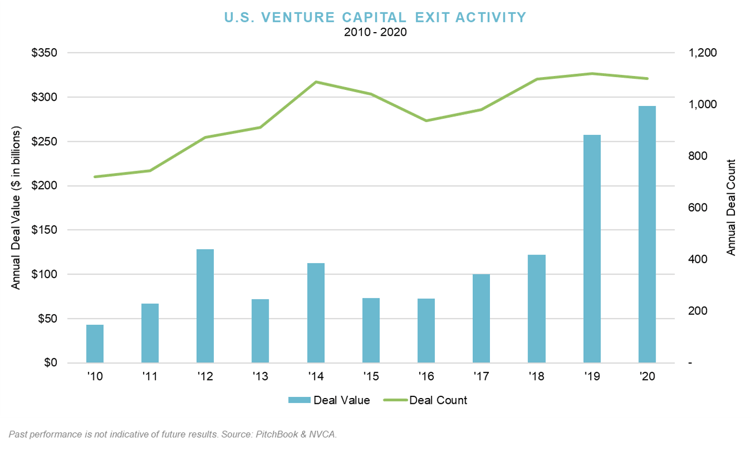
Venture capital deal value topped $150 billion for the first time in 2020, while venture capital exit value hit a record $290 billion after a surge of public listings in the second half of the year, surpassing the more than $250 billion of exit value in 2019. SPAC issuance accounted for nearly 50% of the exit value via public offerings. New venture capital funds raised $73.6 billion in 2020. While we are encouraged by these recent trends and continue to deploy capital to venture investments at a measured pace, much of the value creation we see in Verger’s venture portfolio is the result of investments we made over the past several years. Anyone attempting to build out a new venture portfolio from scratch today would likely not see the fruits of their labor for several years.
Bank Stocks
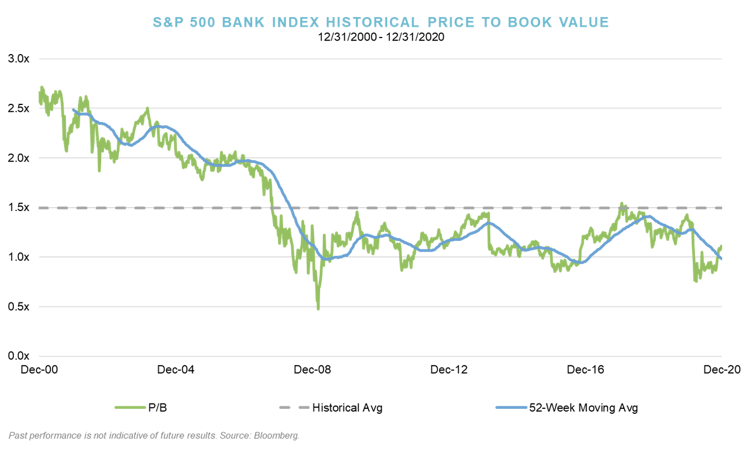
We believe that a compelling opportunity existed to invest in the banking sector, particularly in community and regional banks based on a variety of factors.
- First, as you can see from the chart below, bank stocks are at very attractive valuations, trading at or below tangible book value.
- Second, bank balance sheets are currently strong and there is a high likelihood of bank consolidation given current valuations.
- Finally, additional U.S government stimulus support provides strong liquidity to the U.S. banking system.
We took advantage of opportunities in the sector by investing in a bank specific strategy in December and are already seeing positive movement in the first few weeks of our investment. However, valuations of bank stocks are still well below their historical average we anticipate further appreciation particularly if further regional bank consolidation occurs.
Real Assets
As referenced earlier, the COVID-19 crisis spurred trillions of dollars in fiscal and monetary stimulus which has significantly increased the money supply and the size of global central bank balance sheets. This may create a scenario particularly suited to an inflationary environment going forward, as illustrated below.
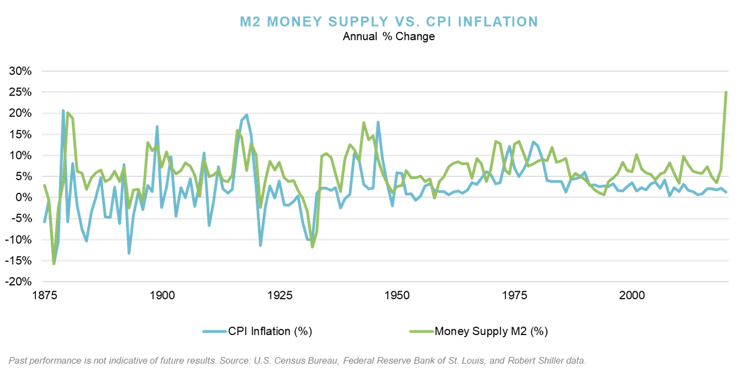
Historically, one of the best performing sectors during an inflationary environment has been real assets, including commodities, real estate, energy, and more. Many of these assets are available at attractive valuations resulting from the impact of the coronavirus pandemic across much of the sector.
Closing the Door on an Odd Year
Although not terribly eloquent, “odd” may be the best description for a year when a global pandemic leads to a historically quick sell off and equally historic recovery. A year when the government expends trillions of dollars of stimulus to revive a flailing economy but also fortifies a soaring market with ample liquidity and cheap capital. A year when Main Street continues to struggle despite the successes on Wall Street and we end the year near all-time market highs juxtaposed with elevated unemployment levels.
But we do see some changes ahead – some positive and some negative. We see optimism driven by a nascent vaccine rollout and the potential for a return to “normal” life. The positive impact of even further government stimulus, a potentially dovish Fed, and measured improvement in global economic growth gives us hope for the year ahead.
However, we also see potential for fragility ahead, with a multitude of warning signs giving us pause. From a historical perspective, we have top market valuations with near bottom economic conditions. All the noise from examples of late cycle “irrational behavior” like GameStop, AMC and Tesla, seems to be overshadowing the larger issues of financial stability, pressures on efficient price signaling, the trust of market participants, and reliance on the Fed.
Capital is difficult to accumulate and easy to lose. Price matters and protection is not popular in bull markets. Protecting the downside in Q1 and capturing the upside in Q3 and Q4 is what you should expect from Verger as we seek to both grow and protect capital for the long term. We appreciate and are grateful our clients’ confidence and our entire team is focused on one, singular mission – yours.
All investments involve risk, including possible loss of principal.
Not all strategies are appropriate for all investors. There is no guarantee that any particular asset allocation or mix of strategies will meet your investment objectives. Diversification does not ensure a profit or protect against a loss.
One cannot invest directly in an index, and unmanaged indices do not incur fees and expenses.
This article is being provided for informational purposes only and constitutes neither an offer to sell nor a solicitation of an offer to buy securities. Offerings of securities are only made by delivery of the prospectus or confidential offering materials of the relevant fund or pool, which describe certain risks related to an investment in the securities and which qualify in their entirety the information set forth herein. Statements made herein may be materially different from those in the prospectus or confidential offering materials of a fund or pool.
This article is not investment or tax advice and should not be relied on as such. Verger Capital Management (“Verger”) specifically disclaims any duty to update this article. Opinions expressed herein are those of Verger and are not a recommendation to buy or sell any securities.
This article may contain forward-looking statements relating to future events. In some cases, you can identify forward-looking statements by terminology such as “may,” “will,” “should,” “expect,” “anticipate,” “believe,” “potential,” or “continue,” the negative of such terms or other comparable terminology. Although Verger believes the expectations reflected in the forward-looking statements are reasonable, future results cannot be guaranteed. Except where otherwise indicated, all of the information provided herein is based on matters as they exist as of the date of preparation and not as of any future date and will not be updated or otherwise revised to reflect information that subsequently becomes available, or circumstances existing or changes occurring after the date hereof.
References to indexes and benchmarks are hypothetical illustrations of aggregate returns and do not reflect the performance of any actual investment. Investors cannot invest in an index and do not reflect the deduction of the advisor's fees or other trading expenses.