
Alphabet Soup
If the year 2020 has taught us anything, it is to expect the unexpected. As the markets continue to perplex investors, financial commentators have relied on various turns of phrase and an alphabet soup of acronyms to explain what’s happening. Buy the dip (BTD), fear of missing out (FOMO), keep it simple stupid (KISS), there is no alternative (TINA), and many more.
While these bite-size phrases may be convenient, they do little to provide any clarity as to what investors should do in the face of multiple challenges including the election, COVID-19, record high valuations, and continued government intervention into our fragile economy and financial system. Despite these headwinds, the 3rd quarter felt relatively uneventful compared to the volatile swings experienced in the 1st and 2nd quarters, yet the path ahead remains unclear.
An Unclear Path to Economic Recovery
Unprecedented government stimulus has helped support an otherwise weak economy. The Fed and Central Banks have leveraged almost every liquidity and lending program in their playbook – Permanent Open Market Operations (POMO), Temporary Open Market Operations (TOMO), and MMLF (Money Market Liquidity Facilities) to name a few – to ease financial conditions and subsequently create a floor for global equities and bonds. And, to pile on, global central banks are buying a wide range of assets at a scale that is hard to believe.
The question remains: how long can this last?
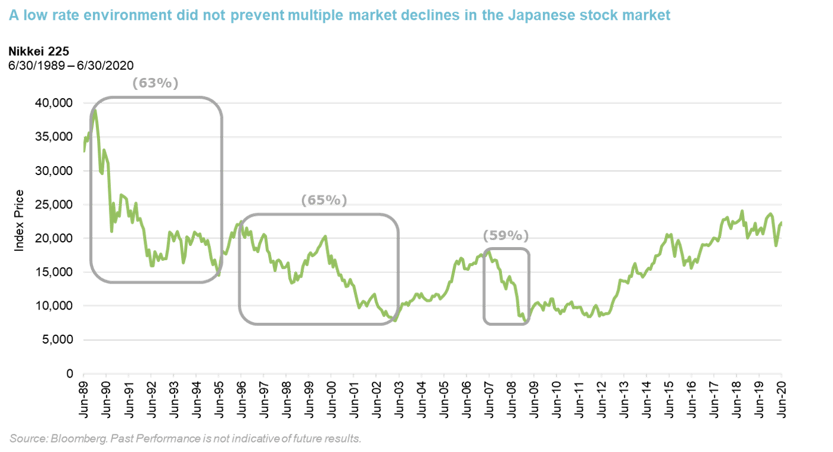
It is difficult to shake the feeling that we may just be kicking the can down the road. Especially since we have seen this movie play out before in Japan, where interest rates have been in an overall decline since the early 1990s. Japanese rates have essentially flatlined with 10-year rates that have not exceeded 2% since 1998 and are currently sitting at zero. Unfortunately for Japan, a declining interest rate environment did not lead to higher equity returns over the long-term. Over a 30-year period beginning in 1990, Japanese equity markets experienced declines of about 60% on three different occasions. Japan’s low rate environment has extended much longer than where we stand in the U.S. today and Japanese equities now trade at just under three times their lows. However, they would still need another almost 100% in gains to reach their levels from 30 years prior.
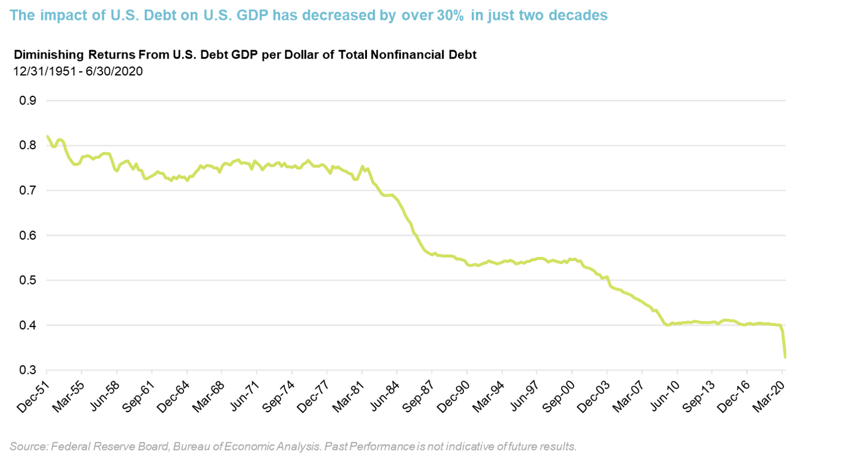
During the same 30-year period, government spending in Japan sky-rocketed to nearly 250% of GDP and has hovered around that level for the past five to seven years. Today, we see a similar story in the U.S. with growing concerns over a potential ‘debt trap’ – a vicious, self-perpetuating cycle in which too much debt weakens economic growth, eliciting a policy response that creates more debt and results in increasingly disappointing business conditions. You can see the diminishing impact of U.S. debt on GDP growth illustrated in the chart below. The impact of government debt on GDP has decreased by over 30% in the last two decades, while government debt as a percentage of GDP has grown from 33% in 1980 to an anticipated 130% by the end of this year. Historically, declines in economic growth rates have coincided with record levels of public and private debt, so, the idea of borrowing our way to prosperity is a questionable strategy that is unlikely to be successful. The flashy 33% GDP growth number for the third quarter is more a statistical fluke and reflection of the sharp dive in the 2nd quarter and subsequent bounce in the 3rd, not an indication of current momentum. Growth in the U.S. is still more than 4% below its level at the end of 2019.
However, the biggest threat to economic recovery appears to be the global spread of COVID-19. While the pandemic is driving revolutionary innovation in some market sectors, economic activity levels remain at the lowest level since the great recession and there are more layoffs anticipated due to delayed fiscal stimulus. Uncertainty about the ongoing spread of the virus is only heightened as we head into the typical winter months’ cold and flu season. The best solution to alleviate the strain of COVID-19 on the U.S. and global economy is the delivery of a vaccine, which may take longer than we would hope or expect.
Continued Disconnect with U.S. Markets
Over the past 10 years the low rate environment in the U.S. has driven equity markets higher making a passive 60/40 allocation attractive for many investors. The current conditions of falling earnings and zero-bound rates continue to drive valuations higher, and with the Fed giving indications of no plans to materially raise rates for at least the next few years, yields are expected to remain low for an extended amount of time. This environment serves to further condition investors with a FOMO (fear of missing out) and TINA (there is no alternative) mindset, as they are forced to chase higher risk alternatives to try to find return, predominately in equity markets.
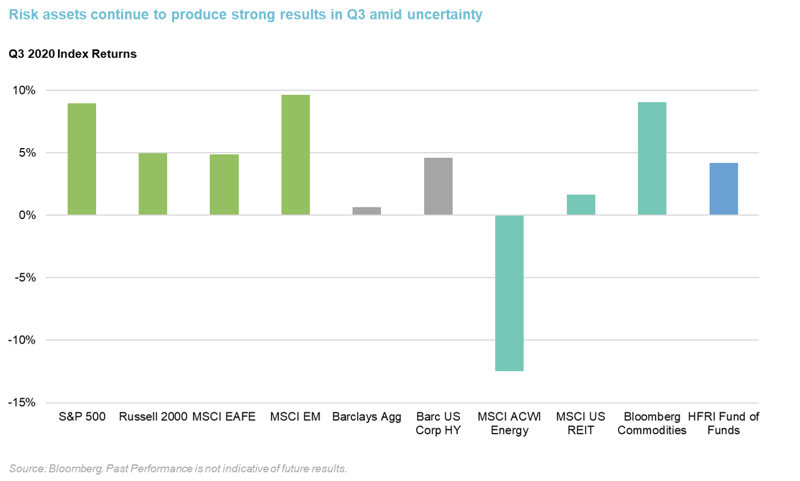
A review of risk assets illustrates the continued market rally in the 3rd quarter. The big story was around growth and big tech names, but the headlines are a bit misleading after taking a closer look at returns, earnings, and valuations. Take the S&P 500, for example.
The S&P 500 reached all-time highs despite a reduction in earnings and lower forecasts ahead. Earnings for 2020 were down over 35%, and next year they are estimated to be lower by 7%. Also concerning, nearly two-thirds of the index is underperforming so far this year with only one in three stocks in the green year-to-date. One in five stocks is down 50% or more from its all-time high. For the calendar year to date through October, the S&P 500 is approximately flat, however equal weighting the index, it would be down 8%.
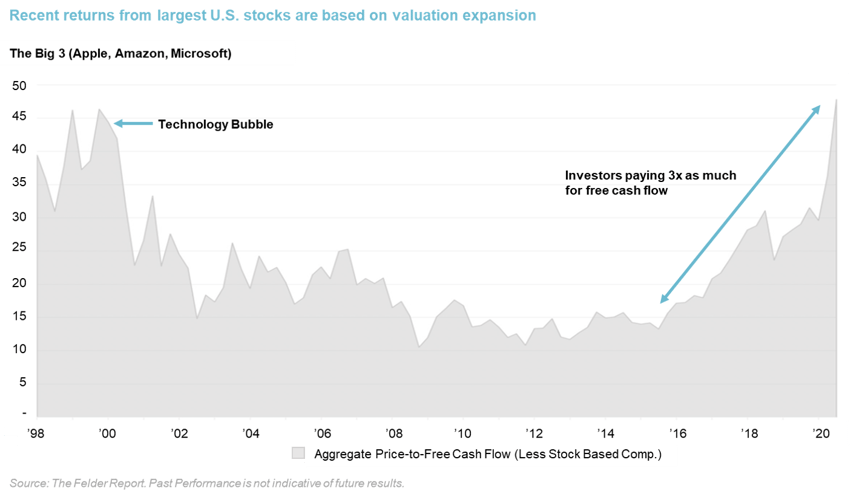
U.S. large cap performance was driven by FAANG (Facebook, Apple, Amazon, Netflix, and Google/Alphabet). Those five stocks are up 70% year to date through October, while the remaining stocks in the index are flat or down for the year. The five largest stocks in the S&P 500 -- Apple, Microsoft, Amazon, Facebook, and Alphabet (Google) – have a combined market capitalization that equals that of the smallest 389 stocks! Apple, Amazon, Microsoft, and Google alone have a combined market capitalization that is greater that the GDP of every country in the world, except for the U.S. and China. That is four companies! While growth stories like Amazon, whose stock gained 64% just this year pushing its valuation past $1.5 trillion, are impressive, price is not value. If we analyze the valuation metrics, we believe these big tech names seem to be overvalued. They are great companies with great businesses, but they are priced to perfection. We saw it when Microsoft blew out expectations on revenue and earnings and the stock traded down. Are these companies in fact three times more valuable than they were just four years ago? Meanwhile, we are seeing slowing growth and increased pressure from regulators, especially in a potential progressive administration. If it was a bubble in 2000, what is it now?
Nobel prize-winning economist, Robert Shiller, recently wrote an op-ed piece in the New York Times calling the market “an adventure". By his measurement, never in U.S. market history has there been as great a disconnect between economic reality and equity prices as there is today. Shiller called the rebound “vexing” using his CAPE (cyclically adjusted price to earnings). Price-to-earnings ratios are now in the 98th percentile at the same time where GDP as a measure of the economy is at near all-time lows. This has happened only twice before – first in the 1920s prior to the Great Depression and again in 2000 at the NASDAQ peak. Even in 2008 the CAPE did not exceed 30, where it sits now. It’s well above the long-term average of 17 and even above the 25.6 it averaged the last 20 years.
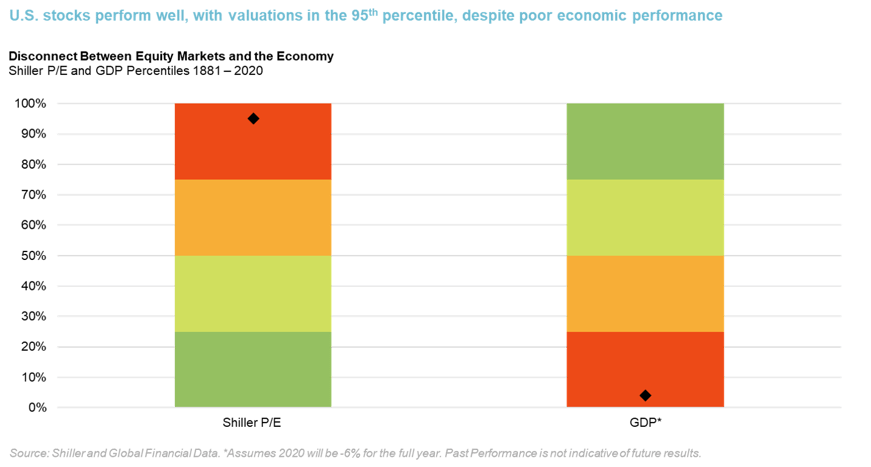
Despite these realities, market valuations are at levels that suggest double-digit earnings growth ahead, even in the face of evidence indicating protracted economic recession, high unemployment, reduced business and consumer spending, lower sales growth and, oh yeah, a global pandemic.
Election Uncertainty
We would be remiss if we did not address the looming uncertainty that surrounds tomorrow’s election. We know from 2016 that polls are fallible, though there is some consensus that polling has improved since the last election. Regardless, it would be unwise to attempt a prediction given the uncertainty that surrounds this year’s race. Early voting has seen record turnouts, but with the last debate in the rear-view mirror, and with so few undecided voters this cycle, the result is likely to hinge on each campaign’s ability to encourage voter turn-out, rather than trying to persuade the undecided. We will all be watching and there are certainly some twists and turns in store in the coming days and weeks. While the outcome is important for investors, what matters more in the near-term is when the election is decided, not who wins. The real risk of a contested election could have a significant near-term impact on the markets, which above anything, loathe uncertainty.
Looking Ahead
The election will likely be front of mind and we would be wrong to downplay its importance. Ultimately, the outcome of this election only answers one question – who will be President. Near-term, the election will not solve the real issues our clients, friends, and fellow Americans face – the COVID-19 pandemic, the fragility of our economic system, or the current disconnect between the economy and the markets.
Long term vision is rare and difficult to obtain, but non-profit institutions, particularly those with a perpetual time horizon, demand that vision to protect the future of their organization. After a few years of smooth functioning markets, our concern is complacency. Investors are seemingly ignoring risk, eliminating spare capacity, increasing leverage, and relying on unsound and fragile structures (both the economic and organizational) while neglecting any preparation for real adversity and volatility. Time is running out to proactively build a diversified strategy that will perform across a variety of markets and outcomes. This has been Verger’s focus since our inception, and we are more confident than ever that we have built a portfolio to perform regardless of which way the winds turn.
All investments involve risk, including possible loss of principal.
Not all strategies are appropriate for all investors. There is no guarantee that any particular asset allocation or mix of strategies will meet your investment objectives. Diversification does not ensure a profit or protect against a loss.
One cannot invest directly in an index, and unmanaged indices do not incur fees and expenses.
This article is being provided for informational purposes only and constitutes neither an offer to sell nor a solicitation of an offer to buy securities. Offerings of securities are only made by delivery of the prospectus or confidential offering materials of the relevant fund or pool, which describe certain risks related to an investment in the securities and which qualify in their entirety the information set forth herein. Statements made herein may be materially different from those in the prospectus or confidential offering materials of a fund or pool.
This article is not investment or tax advice and should not be relied on as such. Verger Capital Management (“Verger”) specifically disclaims any duty to update this article. Opinions expressed herein are those of Verger and are not a recommendation to buy or sell any securities.
This article may contain forward-looking statements relating to future events. In some cases, you can identify forward-looking statements by terminology such as “may,” “will,” “should,” “expect,” “plan,” “intend,” “anticipate,” “believe,” “estimate,” “predict,” “potential,” or “continue,” the negative of such terms or other comparable terminology. Although Verger believes the expectations reflected in the forward-looking statements are reasonable, future results cannot be guaranteed. Except where otherwise indicated, all of the information provided herein is based on matters as they exist as of the date of preparation and not as of any future date, and will not be updated or otherwise revised to reflect information that subsequently becomes available, or circumstances existing or changes occurring after the date hereof.